Prosper
This project happened during my PhD in the GESVAB under the direction of Dr. Pierre Waffo-Téguo. There is a description of that work in French in my dissertation.
Why?
The main objective of that experiment is to do a multi-modal (as in different types of) Centrifugal Partition Chromatography (CPC) analysis of the components of a sample. The sample can be anything really (crude oil, radionucleides, drugs), in that case it was a series of plant extracts.
A traditional analysis consists only of a Pump, the CPC, the UV detector and the Fraction collector, all in series.
- The pump provides a mixture of solvents at the appropriate flow rate (in our case here 6mL/min at 50 bars max).
- The CPC is doing the separation of the sample along the flow of solvent. The different components will elute at different time. I will skip the theory of CPC for this page, I may do a page about that one day.
- The UV detector will measure how much the flow of liquid absorbs UV light that is shined at it. If the components absorb UV light, we will see an increase of the signal on the detector. That’s a common way to detect molecules, even if they are not all absorbing UV light.
- The fraction collector is used to collect the different molecules from the different fractions, usually tubes sometimes bottles. Most of the time we do a time-based collection, the fraction collector is advancing to the next tube every x seconds.
But for this experiment we are doing things a bit differently. We want to be able to, at the same time, analyze the components eluting out of the CPC in live by Mass Spectrometry and UV spectrophotometry and later by Nuclear Magnetic Resonance (NMR) analysis. Technically it would have been possible to do the NMR analysis in parallel, but the machines were in two different buildings.
Structure of the experiment
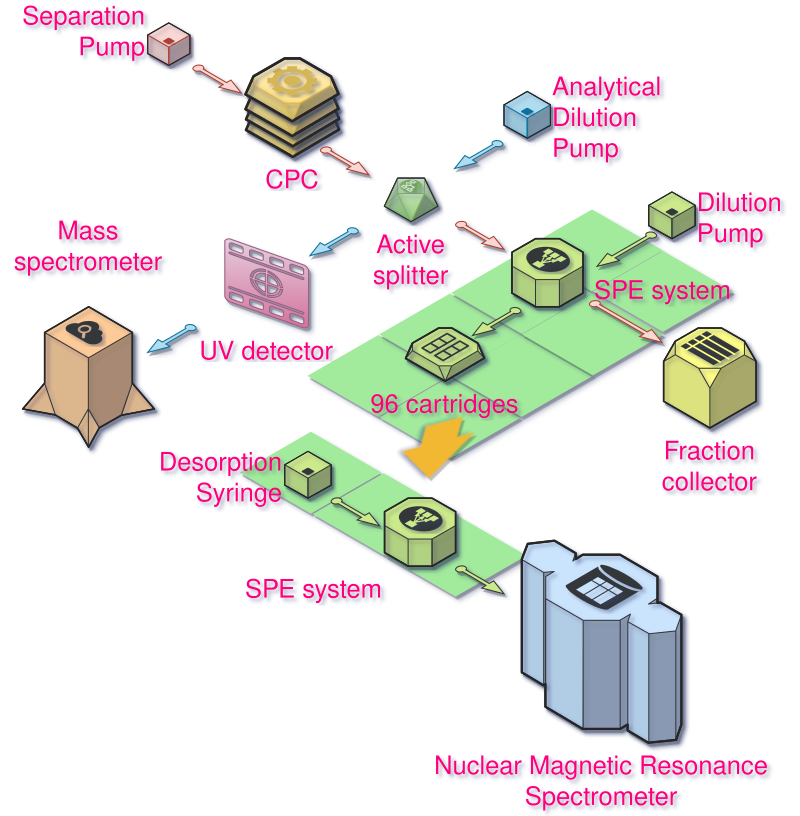
This is the general scheme of the experiment:
Modifying the SPE system
We are going to use a Spark SPE system. It is a robotic system able to take tiny cartridges from two 96 well plates, put them in clamps, and redirect fluids either from the outside or from the two syringes it is equipped with. It is called SPE for Solid-Phase extraction. The cartridges are filled with tiny particles of a material (you can choose from tens of them) on which molecules of interest can stick, and be washed-off (eluted) later.
The problem is that this device was configured to do HPLC (High Pressure Liquid Chromatography)-NMR hyphenations. We are talking about different lower flow-rates, different solvents and lower concentrations than what we usually deal with when doing CPC. So it required some hardware changes. And the software was only meant to do HPLC analyses and didn’t really allow for manual control of the system the way we wanted to.
Here is what the device looks like:

On the left are the two automated syringes (HPD-S1, HPD-S2) and their distribution valves (HPD-V1 and HPD-V2) that allow taking solvent from different bottles and sending it to the rest of the system.
On the bottom right, you can see the robotic system that handle the cartridges seen from above:
- ACE-PG, ACE-PD are the two clamps that can hold the cartridges and connect it to the fluidic system
- ACE-B the arm that moves laterally and can bring the cartridges to the left or right clamps.
- ACE-R1, ACE-R2 the two racks containing the cartridges
- ACE-P the part responsible for the back to front movement of the plates so they align with the arm.
On the top right are 4 valves that allow to change the distribution of liquids in the machine:
- ACE-V1 is the valve we use to do the sampling.
- ACE-V2 allows to choose which column (left or right) will be used
- ACE-V3 allows the distribution of either solvent from ACE-V1, nitrogen (to dry the cartridges), or the syringes (HPD)
- ACE-V4 is used to in the case we want to collect the output of the columns or send it to the waste. That’s where you connect the NMR probe when you want to recover the compound.
And here is how things are connected:

The changes that were made on the device can be seen on the scheme above in purple. The purpose here is to be able to sample tiny amounts of liquid flowing out of the CPC outlet, and redirect that to the cartridges. In the mode displayed, the outlet of the CPC is flowing to the detection side. But when the ACE-V1 valve is switched the flow is redirected to the loop (between 8 and 3). When the valve ACE-V1 is switched back, this flow is pushed by the Pump (on the right) to the cartridge in PG.
So by controlling this valve, the pump and the change of cartridge, one can collect arbitrary amounts of solvent flowing out of the CPC, dilute it with whatever is pumped by the right pump. In this case, we used resin-based cartridges (Polystyrene-Divinyl Benzene) that were able to store almost 1mg of some molecules on them. This is a lot, they are really tiny 10mm high with an internal diameter of 1 or 2mm (we use the 2mm). They are also able to handle pressures of ~300bars, but in our case they probably see only a fraction of that.
The analytical flow
The (red) flow out of the CPC gets sent to an active splitter where tiny amounts of it (nano-liters) will be sampled in the analytic solvent flow (in blue on the figure) at a frequency of ~ 1 Hz, even if this can vary depending on how much you want to send to the analytical side.
This active splitter is an interesting device, but quite rare in labs and unfortunately extremely expensive. Having cheaper alternatives for that device would be great, but that’s another discussion.
It works by switching rapidly a grooved disk in the solvent flow and transferring that groove to another solvent flow.
The disk itself looks like:
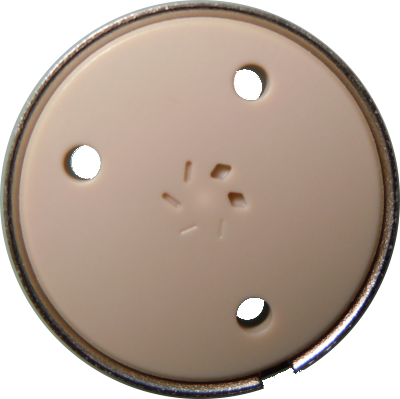
You see several grooves here. That’s because this device’s ratio is adjustable using discrete settings that combine a specific groove and a specific frequency.
Here is a schematic of what happens during the switching:

The rest of the flow goes to the Spark SPE system.
The SPE flow
In the SPE system, a tiny amount of this flow (100 μL) gets sampled and sent to a solid-phase cartridge using the flow from the Analytical Dilution Pump. The solvent pushed by this pump also helps with trapping the compounds of interest on the cartridge as some solvents from the CPC can be too strong. You can think of it as a black marker on glass. If you use pure acetone, you can remove the black marker, if you dilute the acetone in water, it will become harder. In our case, we want the compounds to stick (we say bind) as strongly as possible to the cartridge. The rest of the flow is sent to a normal fraction collector.
What does it allow
This whole setup allows for several things:
- separating materials while having a live display of when its different components gets eluted from the CPC column
- high-resolution decomposition of a separation (don’t need NMR for that, just MS in enough) which can help with method development
- fast handling of compounds, especially valuable with sensitive compounds
- ability to acquire Nuclear Magnetic Resonance (NMR) spectra from the samples without preparation.
Of course the different branches of this scheme can be scaled depending on what the purpose of an experiment is. One could use a large-scale SPE column or even normal column to conduct a 2D analysis etc.
In our case, we want to do on-line MS and UV analysis and off-line NMR analysis. To do all of that, the SPE system had to be modified.
Reverse-engineering and control software development
As I said earlier, the system had to be modified (we talked about that already) and a custom software had to be developed.
For that, I had to sniff the serial connection between the existing software and the machine, understand the structure of the commands and then try sending them back to see if they were doing what they were supposed to do.
A full list of the codes is available as Supplementary information with the published article on that project.
After collecting those codes, I created a simulator in Python that would make the manufacturer software believe the machine was connected to it. The purpose was to make sure that all the commands were understood properly (there was no documentation of any sort and the manufacturer was not able to help).
Here is a rough structure of how the simulator is made:

I always found that developing a simulator for the device we try to control before anything else makes life much easier when we need to develop applications for it. And the added benefit is that you can just put your simulator in your software and you don’t need to be next to the machine to develop it or configure it.
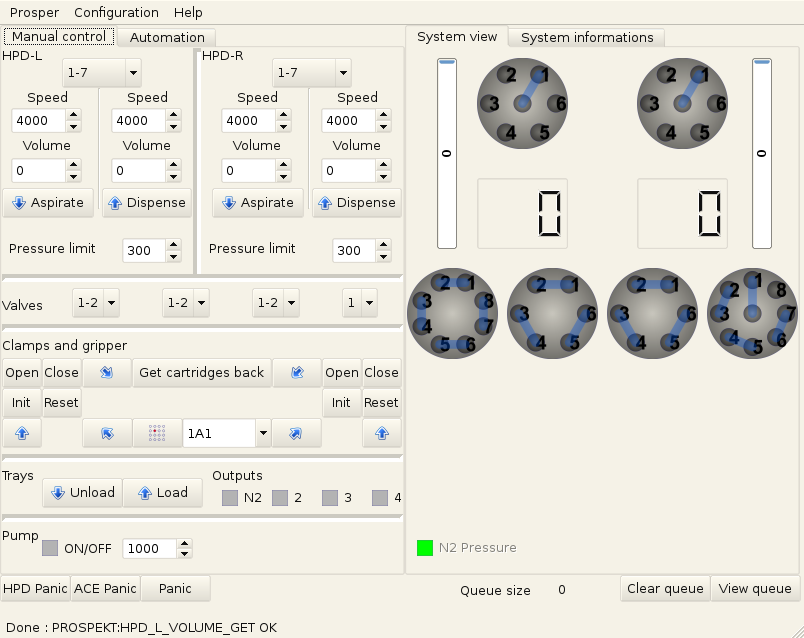
Once I had that, I was able to develop a graphical interface that allowed the user to take full control of the machine and control the external pump at the same time (it was serial as well and this one was documented).
The user can control all the valves, syringes, arms as well as the gas valve which I didn’t mention earlier. It also provides a view of the status of the system (as in the real status as we query it regularly on a background thread).

The interface was made using PyQt. It turned to be a great choice, development was fast and easy and not having to handle the events by hand is always a relief.
You can see an automation tab here, this was never coded fully, as most of the time we wanted to control precisely what gets collected (and a CPC run is pretty fast usually). With a bit more time, getting data from the MS to react on the presence or absence of some masses would have been great. But the proprietary protocols of most mass spectrometers and their lack of documentation do not make that easy.
Running that on a Fallopia japonica root and leaves extract separation:

If you look closely at the cyan peaks, you will see vertical marks, these correspond to the collection process (the material was going to the cartridge, not the detectors).
Bringing one of the cartridge, after nitrogen drying, of the Stems second peak to the Nuclear Magnetic Resonance spectrometer that has a prospekt as well. We can take a proton spectrum. This was just a few scans, remember we have almost 1mg on a cartridge and it was using an LC-NMR probe with an internal coil volume really small as the liquid volume inside the coil is 70 μL. The other advantage, is that we have much less issues with shimming as we can always use pure acetonitrile or acetone to desorb the compounds from the cartridges.
The software
To be fair, the code quality is absolutely terrible. This project was made years ago and since then I was able to improve (well I hope…) my coding skills. I also moved to a place where there is no device of that sort. So I am not in a position, nor in the need, to make it evolve at this time. But I’m still using what I learned from that project when making software for lab automation, something I continue to enjoy doing.
Code can be found at : Github bjonnh/prosper.
What I learned
I learned quite a lot doing that project. The hardware part was mostly plumbing so nothing really fancy here. But the reverse-engineering part was fun, and you get some cold-sweats when you send the wrong command and the device slams in a part. I was also able to use PyQt which I had only used for toy projects. I also learned how to deal with complex instruments and communications that can have delays, failures, incorrect outputs… It was also interesting to code this kind of things with a high-level language. To control physical devices, I had only used Arduino (in C++) and other microcontrollers (mostly C and ASM) and programmable logic controllers (PLCs). So it was a completely different way to deal with timings, lags and so on.